JVMs getting OOM-killed? Try SapMachine High Memory Reports
Analyzing OOM-kills is no fun. You fly mostly blind, have no meaningful logs - your JVMs just keep disappearing. It can be highly frustrating work.
If that sounds familiar, we may have something for you.
OOM-kills are sudden death. The JVM gets no warning, it just receives a SIGKILL from the kernel. Or its container itself may get stopped from outside.
Interesting fact: other Unices warn you. AIX, for example, sends your process a SIGDANGER before killing it. A little politeness goes a long way. But, alas, the Linux kernel does not bother with niceties.
Since the JVM gets killed, it cannot write a crash log. We may have OS logs or container logs, so we may know the offending memory size of the JVM process. But often, we have little information about what went on within the JVM.
Enter SapMachine High Memory Reports - a facility built into our SapMachine JVM that makes cases like these easier to analyze.
How it works:
The JVM defines a memory threshold at which it expects to be in imminent danger of being purged by the OOM killer. Said threshold depends on context - physical memory on a physical box, cgroup limits in a container. That value usually works but can be manually overridden.
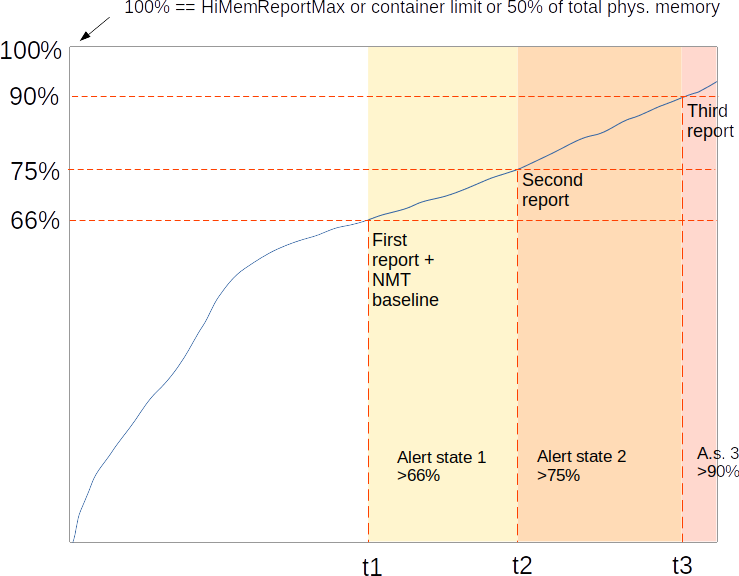
Trigger points are set at 66%, 75%, and 90% of that primary threshold.
The JVM then monitors RSS: upon reaching each trigger point, it generates a report. In addition, it executes a set of programmable commands.
The theory behind this simple design is that even if we get killed without a trace, at least one - hopefully more - of the three trigger points will have fired beforehand, caught the JVM with an already pathological footprint, and given us enough information to start analyzing.
The generated reports contain, among other things, SapMachine Vitals and NMT reports. SapMachine Vitals is a recording of JVM- and system metrics. It allows you to look “back in time” to see the development running up to the memory shortage. Native Memory Tracking (NMT) contains information about the memory consumption of the core JVM.
Enabling High Memory Reports
The HiMem Report facility is enabled with -XX:+HiMemReport:
java -XX:+HiMemReport ...
Controlling the threshold
If you start with -Xlog:vitals, SapMachine tells you the primary threshold it deduced. For example, started in a container with a memory limit of 2G, it sets the primary threshold to 2G as well:
thomas@container1: $ java -XX:+HiMemReport -Xlog:vitals
[vitals] Vitals HiMemReport: Setting limit to cgroup memory limit (2048000 K).
You may override the limit with -XX:HiMemReportMax=<size>. This will shift the trigger points. For example, if you specify -XX:HiMemReportMax=1G, triggers will be established at 660M, 750M and 900M, respectively.
Where does the report go?
High Memory Reports go to stderr, unless you redirect them with -XX:HiMemReportDir=<directory>:
java -XX:+HiMemReport -XX:HiMemReportDir=~/my-himem-reports
The file - or files - will contain the PID of the JVM process, as well as a timestamp, for example:
thomas@starfish:~/my-himem-reports$ ls
sapmachine_himemalert_pid758099_2023_02_10_16_03_41.log
Execute arbitrary jcmds at trigger points
High Memory Reports can run arbitrary jcmds for you whenever an alert is triggered. Commands are specified via -XX:HiMemReportExec=<commands>. Multiple commands can be specified but have to be separated by semicola.
For example, this command:
java -XX:+HiMemReport '-XX:HiMemReportExec=VM.info;VM.flags -all;VM.metaspace show-loaders'
will execute at each trigger point:
jcmd <my-pid> VM.infojcmd <my-pid> VM.flags -alljcmd <my-pid> VM.metaspace show-loader
These commands are a powerful and flexible way to expand reporting. For example, run -XX:HiMemReportExec=GC.heap_dump to get a Java heap dump at each trigger point. Please see [2] for more details.
An Example
Let us start a spring-boot application that takes about 400M.
We set its primary threshold to 500 MB and redirect reports to the file system. At each alert point, we print VM flags and create a Java Heap dump:
java -XX:+HiMemReport \
  -XX:HiMemReportMax=500m \
  -XX:HiMemReportExec='VM.flags -all;GC.heap_dump' \
  -XX:HiMemReportDir=my-himem-reports \
  -XX:NativeMemoryTracking=summary -jar $SPRING
While running, we happen to trigger two alerts - at 66% and 75%. We don’t quite reach the 90% limit, so no third alert:
              |\      _,,,--,,_
             /,`.-'`'   ._  \-;;,_
  _______ __|,4-  ) )_   .;.(__`'-'__     ___ __    _ ___ _______
 |       | '---''(_/._)-'(_\_)   |   |   |   |  |  | |   |       |
 |    _  |    ___|_     _|       |   |   |   |   |_| |   |       | __ _ _
 |   |_| |   |___  |   | |       |   |   |   |       |   |       | \ \ \ \
 |    ___|    ___| |   | |      _|   |___|   |  _    |   |      _|  \ \ \ \
 |   |   |   |___  |   | |     |_|       |   | | |   |   |     |_    ) ) ) )
 |___|   |_______| |___| |_______|_______|___|_|  |__|___|_______|  / / / /
 ==================================================================/_/_/_/

HiMemoryReport: rss+swap=367772 K - alert level increased to 1 (>=66%).
############
#
# High Memory Report:
# pid: 758099 thread id: 758115
# rss+swap (367772 K) larger than 66% of HiMemReportMaximum (512000 K).
# 2023-02-10 16:03:41
# Spike number: 1
#
# Printing to /home/thomas/my-himem-reports/sapmachine_himemalert_pid758099_2023_02_10_16_03_41.log
# Done.
#
HiMemReport: Successfully executed "VM.flags -all" (217 ms), output redirected to report dir
HiMemReport: Successfully executed "GC.heap_dump /home/thomas/my-himem-reports/GC.heap_dump_pid758099_2023_02_10_16_03_41.dump" (176 ms), output redirected to report dir
HiMemoryReport: ... captured NMT baseline

HiMemoryReport: rss+swap=413984 K - alert level increased to 2 (>=75%).
############
#
# High Memory Report:
# pid: 758099 thread id: 758115
# rss+swap (413984 K) larger than 75% of HiMemReportMaximum (512000 K).
# 2023-02-10 16:03:44
# Spike number: 1
#
# Printing to /home/thomas/my-himem-reports/sapmachine_himemalert_pid758099_2023_02_10_16_03_44.log
# Done.
#
HiMemReport: Successfully executed "VM.flags -all" (100 ms), output redirected to report dir
HiMemReport: Successfully executed "GC.heap_dump /home/thomas/my-himem-reports/GC.heap_dump_pid758099_2023_02_10_16_03_44.dump" (233 ms), output redirected to report dir
And look at this: several log files popped up in our report directory.
thomas@starfish:~/my-himem-reports$ ls
GC.heap_dump_pid758099_2023_02_10_16_03_41.dump
GC.heap_dump_pid758099_2023_02_10_16_03_41.err
GC.heap_dump_pid758099_2023_02_10_16_03_41.out
GC.heap_dump_pid758099_2023_02_10_16_03_44.dump
GC.heap_dump_pid758099_2023_02_10_16_03_44.err
GC.heap_dump_pid758099_2023_02_10_16_03_44.out
sapmachine_himemalert_pid758099_2023_02_10_16_03_41.log
sapmachine_himemalert_pid758099_2023_02_10_16_03_44.log
VM.flags_pid758099_2023_02_10_16_03_41.err
VM.flags_pid758099_2023_02_10_16_03_41.out
VM.flags_pid758099_2023_02_10_16_03_44.err
VM.flags_pid758099_2023_02_10_16_03_44.out
For each of the two alerts, we get:
- the report itself: sapmachine_himemalert_pid758099_xxx.log. It contains Vitals as well as NMT reports.
- A Heap Dump: GC.heap_dump_pid758099_xxx.dump, as well as stdout and stderr of its jcmd invocation.
- A printout of all VM flags: VM.flags_pid758099_xxx.out
Why is this SapMachine-only? Why not contribute it to mainline OpenJDK?
We plan to contribute this feature upstream but expect this to take some time. Typically, features like these are not contributed verbatim but will have to go through a lengthy design process. We’ll see.